Quantifying the Effect of BIM and COBie for FM

This paper investigates the effects of using building information modeling (BIM) and construction-operations building information exchange (COBie) data for facility management in Texas A&M Health Science Center buildings.
Quantifying the effect of using BIM and COBie for facility management on work order processing times: a case study
Sarel, Lavy1 and Nishaant, Saxena2
Abstract
This paper investigates the effects of using Building Information Modeling (BIM) and Construction-Operations Building Information Exchange (COBie) data for facility management (FM) in Texas A&M Health Science Center (TAMHSC) buildings. Studies conducted in the past have determined that obtaining quick access to information about building systems can reduce work order processing time. While earlier studies were based on interviews and surveys, this paper utilizes actual work order data exported from the Computerized Maintenance Management System (CMMS) used by TAMHSC. In order to compare the performance of TAMHSC campuses that use BIM for FM with the campuses that use a drawing based approach, a two sample t-test was conducted on the “actual number of hours” taken to process maintenance work orders. Statistical analysis contradicts the perception that work order processing time may be reduced by using BIM for FM. However, the results may not convey an accurate scenario as there were no standard policies for recording work order data across all campuses. Hence, this study identifies the importance of developing standards from the very beginning of a project in order to validate the effects of using BIM and COBie data for FM.
Keywords: Building Information Modeling, Computerized Maintenance Management System, Construction-Operations Building Information Exchange, Facility Management, Texas A&M Health Science Center.
Introduction
A study conducted by the U.S Department of Commerce Technology Administration, National Institute of Standards and Technology (NIST) (2004) states that inadequate interoperability is a major cause of inefficiency in the capital facilities industry. The report estimates the financial cost of inadequate interoperability at $15.8 billion per year with owners incurring two-thirds of this cost during the operations and maintenance phase of a facility. In order to improve the operations of any facility, it is most important to integrate different sources of information throughout the project life cycle from the very beginning of a project. A collaborative BIM to FM data exchange solution integrated at the beginning of a project may help reduce life cycle costs with more efficient facility operations and maintenance (O&M) processes and operational workflows (Kasprzak and Dubler 2012). With O&M being the longest phase in the life cycle of any facility, its efficiency is crucial, particularly for healthcare buildings, due to the presence of complex mechanical, electrical and plumbing (MEP) systems, and the sensitive nature of the buildings’ occupants. Thus, adequate interoperability assumes prime importance for the safe and efficient functioning of healthcare buildings.
TAMHSC is an academic unit of the Texas A&M University System that provides comprehensive healthcare solutions through education and research in medical sciences. TAMHSC operates nine campus locations in the state of Texas and has adopted a BIM and COBie-based approach for FM in two of its newly built campus buildings -Bryan and Round Rock, Texas. The other campus buildings located in College Station, Corpus Christi, Houston, Kingsville, Dallas, McAllen and Temple, Texas, still follow the drawing-based approach to FM. Broaddus and Associates (Broaddus) is a privately held facility program management firm that assisted TAMHSC with formulating and implementing BIM and COBie databases for the management of its newer facilities. Broaddus helped integrate COBie data into the CMMS used by Texas A&M University with the help of a software called “AiM,” developed and sold by AssetWorks. Broaddus and AssetWorks conducted a pre-analysis study (Beatty et al., 2013) to estimate the expected reduction in work order processing time that may be achieved by using a BIM and COBie-based process. This study found that there could be a reduction of 8.7% in work order processing time by following a BIM and COBie based approach. This reduction may be attributed to obtaining quicker access to accurate and complete digital information and documents (Beatty et al., 2013). Since the Bryan and Round Rock campuses have been operational for more than three years, abundant data is available in the CMMS to determine the efficacy of the BIM based approach to FM. This paper analyzes the difference in time spent in processing maintenance work orders by using BIM and COBie data for FM in TAMHSC campus buildings.
Literature Review
Importance of interoperability in healthcare buildings
Facility managers in the healthcare industry face unique challenges as they must maintain complex MEP systems while ensuring patient safety (Lucas et al., 2012). Coordinating information from earlier phases of the life cycle, which is often incomplete and housed in multiple systems, may result in delays and monetary loss (Lucas et al., 2013). Response to emergency situations in the facility can affect patients’ exposure to health risks. To improve the management and increase the efficiency of information transfer, a BIM based facility management system was proposed by the researchers (Lucas et al., 2012).
Scope for application of BIM for FM
Research indicates that there is scope for wide scale application of BIM in FM. Using BIM, O&M efficiency can be increased in areas such as locating building components, facilitating real time data access, visualization, marketing, checking maintainability, creating and updating digital assets, space management, controlling and monitoring energy, and emergency management (Becerik-Gerber et al., 2011). To improve the operations of any facility, integrating different sources of information throughout the project life cycle is most important. In order to maximize the interoperability of information, owners should identify these information requirements before beginning a project, and develop a collaborative BIM to FM data exchange solution during the early stages of a project’s life cycle. Such information solutions will help reduce life cycle costs with more efficient facility O&M processes and operational workflows (Kasprzak and Dubler, 2012).
The role of facility owners in the adoption of BIM for FM
Although facility owners play a vital role in the adoption of BIM for FM, many still lack the technical proficiency and knowledge required to manage and fully utilize BIM processes
downstream during operations and maintenance. Research suggests that having a defined plan of action for BIM execution and the skills, staffing, and technology to implement it are better indicators of an organization’s/owner’s competency than are traditional construction administration factors (Giel and Issa, 2014).
Jawadekar (2012) and Lavy and Jawadekar (2014) reported three case studies on projects of the TAMHSC campus buildings, where COBie data was integrated with the CMMS. They found that there were no laid down rules or procedures for turning over COBie data for the Bryan and Round Rock campuses of TAMHSC. Further, the data received from the contractor upon completion of the project was not in an interoperable format like COBie, Microsoft Excel spreadsheets, or Industry Foundation Classes (IFC). Hence, the data had to be recreated by a consultant (Broaddus & Associates) for use with the CMMS. However, the owner did streamline the process of data handover in the Round Rock campus, after applying the lessons learned from data integration for the Bryan campus.
Need to quantify potential benefits from using BIM for FM
The General Services Administration’s (GSA) BIM for FM Guide (U.S. General Services Administration, 2011) states that a reduction in the time to process work orders may be expected since accurate field conditions are known without a time-intensive search of drawings and documents. The Guide estimates that O&M contracting costs could be reduced by 3% to 6% by identifying and tracking facility equipment and square footage, and it may also help reduce the cost for re-documenting. Broaddus & Associates (Beatty et al., 2013) conducted an initial study to estimate the time that could be saved during processing a work order by using a COBie-based process. They used surveys and interviews with facility management staff of the existing Health Science Center campus buildings in Texas to predict potential savings. In their study, the work order process was divided into individual steps to determine the time spent during each step. Reductions in work order processing time are realized in finding and reviewing O&M data, identifying warranty information, visiting equipment, retrieving additional data in the field, and returning to the shop. Hence, according to the facility management staff, there should be a cumulative saving of 11.6 minutes in each work order corresponding to a saving of 8.7% in the processing times. According to the findings of the report, facility managers expressed confidence that obtaining quick access to accurate and complete digital information and documents could save time (Beatty et al., 2013).
The use of advanced technologies is improving efficiency in the building industry, but the information flow among various parties involved is far from seamless. Currently, most organizations in the industry do not quantify cost reductions attributable to improved processes and technologies. Collecting these metrics is essential for understanding the value of implementing this improved technology (U.S Department of Commerce Technology Administration, NIST, 2007). Systems integration and collaboration in the architecture, engineering and construction (AEC)/FM industry are the keys to improving efficiency. Due to the fragmented nature of the industry, a web-based system could help by being a single central repository to store all design information. As evidence of improvements in efficiency, case studies and pilot implementations are needed to validate and showcase these emerging technologies (Shen et al., 2010). BIM is in the early years of application in the facility management industry, and its business value has not been measured and/or quantified yet. Claimed benefits of using BIM are intangible (for example, improved product quality, better decision making capabilities, etc.). Industry participants feel that
using BIM must be beneficial, but there has not been an active effort to quantify or measure these benefits (Becerik-Gerber and Rice, 2010).
Need for establishing strategic goals and methods
A report prepared by the U.S. Army Corps of Engineers, Engineer Research and Development Center (ERDC) (2006) created a roadmap for the implementation of BIM in civil projects within the U.S. Army Corps of Engineers. This report detailed the steps needed for BIM implementation in all phases of a facility life cycle, and highlighted the importance of process improvement in the adoption of BIM by identifying and tracking data for the O&M process. BIM-and COBie-based FM is a relatively new approach, and it is necessary to formulate short-term and long-term strategic goals for BIM implementation within an organization. Additionally, it is important for facility owners to determine the method/s of measuring the impact of BIM before the beginning of a project.
Research Objective, Hypothesis, Assumptions, and Limitations
The main objective of this study is to determine the effect of using BIM and COBie data for facility management by comparing work order processing times. This study analyzes the differences in time spent on processing maintenance work orders by using BIM and COBie data vs. a traditional drawing-based approach for facility management at Texas A&M University’s Health Science Center facilities. In this research, separate analyses were performed for the time spent on processing work orders for the maintenance of mechanical, electrical, plumbing (MEP) systems, and architectural components. Statistical analysis of the time spent on processing work orders were conducted with the null hypothesis being that the mean time spent in processing a maintenance work order is equal for both BIM user and non-BIM user buildings. In order to be able to conduct the statistical analysis in a fair manner, the researchers assumed the following:
- The information entered by workers about the actual number of hours worked on a job is truthful and accurate.
- Since data collected by the TAMHSC does not provide details about the time spent during each step of the work order process, the researchers assumed that the actual number of hours spent on a work order is a sum total of the time spent during each step of the process. This process includes collecting information about the location of a system within a building and specific system information such as manufacturer's instructions for maintenance, warranty, details about past maintenance, etc.
- Different workforce carries out maintenance activities in the various campus buildings. It is assumed that all employees perform at the same level of quality and efficiency.
Limitations
The study was limited to Texas A&M University Health Science Center buildings located in the State of Texas, U.S.A.
Research Methods
Data Collection
The data for conducting this research was obtained from TAMHSC with the assistance of Broaddus & Associates. The data was exported by the facility manager of TAMHSC from the CMMS used by the Texas A&M University System. This data provides details about all maintenance work orders performed in TAMHSC facilities since 2011.
Work Order Process
The maintenance work orders for all TAMHSC campuses except the Houston and Dallas campuses are examined and sorted by the facility manager of TAMHSC. These work orders are issued/requested by building users through the CMMS. Any user of a building (e.g., staff, faculty, maintenance technician, etc.), may place a work order request. Once a work order has been requested, it gets in the queue waiting to be processed. This queue of work orders is then examined by the facility manager of the Bryan campus who sorts and assigns the work order to the campus in which the maintenance task is required. Once the work order has been assigned to a particular campus, all maintenance activities related to the work order are carried out at the campus level. The work order may be a single phase or multi-phase work order depending on the complexity of the system and disciplines involved (mechanical, electrical, plumbing, architectural). The work order may either be completed by the maintenance technicians or put on hold for later completion, if new parts are to be ordered. Once the work order is completed by the technicians, they record the number of hours worked on that work order. These hours are examined at the campus level by the facility managers before updating the status as complete. Texas A&M University System has outsourced FM services for all TAMHSC campus buildings, except the McAllen campus of TAMHSC, to a single organization. As of June 2013, the outsourcing company employs maintenance technicians for all the campuses. Different technicians are employed at different campuses due to the large geographical distance between campuses. Since the maintenance activities for all TAMHSC campus buildings, except one, are carried out by a single organization, it is reasonable to analyze the performance of the campuses that use BIM for FM vs. the ones that do not use BIM for this purpose.
Data segregation
For analysis purposes, the researchers selected work orders for a duration of one year, ranging from September 2013 to September 2014. Since FM services for the McAllen campus are not performed by the same company, work orders from this campus were excluded from the study. Data fields considered for this study included the campus in which the work was performed, description of the work order, work order category (i.e., preventive, corrective, event, etc.), the actual number of hours taken to complete the work order, and work order entry and completion dates. However, work order completion date is not a reliable data field for research as the end date of a work order is recorded when the maintenance supervisor marks a work order as “complete” in the CMMS. Since the supervisor may not update the status of the work order on the actual day it was completed, the end date cannot be used as a reliable data point in this study.
Upon initial examination of the data, a total of 7,429 work orders were observed for the time period ranging from September 2013 to September 2014. There were 2,111 work orders with “zero” number of actual hours worked and as such, they were not included since they represented inaccurate data entered into the system. In addition, all work orders for the Temple campus had zero actual number of hours worked, leading the researchers to exclude that campus from the study. Another significant observation was that there were no work orders for the Corpus Christi campus, and therefore, this facility was also excluded from the study. The campuses which were finally included in the study are: Bryan, Round Rock, College Station, Houston, Kingsville and Dallas. This classification of work orders is illustrated in Table 1.
Table 1: Number of work orders before segregation into categories
| # | Description | Number of work orders |
| 1. | Total work orders in the system | 7,429 |
| 2. | Work orders with “zero” number of hours worked | -2,111 |
| 3. | Work orders not related to BIM | -1,920 |
| 4. | Work orders to be segregated into mechanical, plumbing, electrical, architectural, and other categories | 3,398 |
Data Analysis
In order to study the impact of BIM on different categories, the work orders had to be classified into separate categories. After consulting with the facility manager of TAMHSC and Mr. Hyde Griffith from Broaddus & Associates, it was decided that the work orders for maintenance of MEP systems and architectural components should be analyzed separately. The researchers sought input from the facility manager of TAMHSC for segregation of work orders. Based on the work order descriptions, mechanical category was assigned to the maintenance of air handling units, exhaust fans, etc.; the electrical category was assigned to the maintenance of electrical systems, such as lighting, emergency generator, etc.; the plumbing category was assigned to maintenance of plumbing systems, such as water leaks, problems with drainage of water, plumbing fixtures, etc.; and the architectural category was assigned to the maintenance of building components, such as doors, windows, walls, etc. The other category was used to exclude work orders not related to Building Information Modeling. These included work orders such as event setup, i.e., setting up chairs and tables for functions, telecom system complaints (like changing caller identification numbers), picking up supplies, cleaning areas in the building, moving furniture, etc. Due to time constraints, it was not possible to have all the data segregated by the facility manager of TAMHSC, hence a smaller list of “common” maintenance types was compiled by the researchers. This compact list of work orders was segregated into five categories, namely: mechanical, electrical, plumbing, architectural, and other by the facility manager of TAMHSC. This list was further used as a guide by the researchers for segregating the remaining work orders. After segregating the data, there were 954 work orders in the mechanical category, 1,084 work orders in the electrical category, 636 in the plumbing category, and 724 in the architectural category, for a total of 3,398 work orders. This segregation of work orders is illustrated in Table 2.
Table 2: Work orders segregation for the t-test analyses
| # | Category | Number of work orders (including combined work orders) | Number of work orders (excluding combined work orders) |
| 1. | Mechanical | 954 | 530 |
| 2. | Electrical | 1,084 | 646 |
| 3. | Plumbing | 636 | 550 |
| 4. | Architectural | 724 | 660 |
| Total | 3,398 | 2,386 |
Work orders for preventive and corrective maintenance were combined to conduct the statistical analysis as there was insufficient data in the preventive maintenance category to perform a separate statistical analysis. Work order times from the Bryan and Round Rock campuses were combined into the BIM user category and were compared with the work order times for the College Station, Dallas, Houston and Kingsville campuses, which were combined into the Non-BIM user category. A statistical analysis was carried out with a 95% confidence interval on the time spent on processing work orders by using a two-sample t-test.
Results and Discussion
Statistically significant differences were found to exist between the work order processing times of BIM users and Non-BIM users in the mechanical and plumbing categories, at the .05 level of significance. Results show that in both cases, BIM users have a higher mean processing time. In the electrical and architectural categories, there was no evidence of a statistically significant difference between the work order processing times of BIM users and Non-BIM users. The results of the t-test are summarized in Tables 3 through 6 and a graphical comparison of means is illustrated in Figures 1 through 4.
After observing the results of the t-test, the researchers examined the data in order to understand the reason for the results. Upon examination of work order descriptions in the data entries, the researchers found that there were no standard rules for recording work orders in all facilities. Numerous instances were found where work orders for multiple systems/ components of a building were combined into a single work order in all four categories across all campuses. Examples of combined work orders in the architectural category included a combined work order for renovation in four different labs, modifications in four separate rooms, etc. Instances where different categories of maintenance activities were combined together into a single work order were also observed. One such work order combined carpeting, painting, replacement of modular furniture, and electrical work in the waiting area of a floor. In the mechanical category, there were instances of maintaining multiple exhaust fans, fan coil units, fume hoods, air handling units, etc. through a single work order. In the plumbing category, work orders were combined for leaks in different rooms, inspections of multiple water heaters, inspection of multiple sprinkler valves, etc. In the electrical category, there were multiple combined work orders for fixing, inspecting and testing of lights. Such work orders provide ease of recording but make data validation inconsistent because there is no way to find out how many lights were actually inspected/fixed, how complex was the repair process, and how much time was spent walking inside a building or multiple campus buildings within a campus when fixing the lights. This inconsistency can be observed clearly by examination of the combined work orders for monthly check of lighting placed in the Houston campus. The time taken to check the lighting varied considerably from 59 hours in the month of January, 2014, to just 5 hours in the month of April, 2014.
Inspection is a unique category of maintenance that, if performed individually for each component, would become cumbersome and result in inefficiency. Another factor to be considered for inspection activities is that MEP systems are complex in nature, since a system is composed of machines connected together with electrical wires, water pipes, or ducts. This increases the complexity of inspection activities as deficient performance of a system may not be due to suboptimal performance of any one machine. Hence, grouping inspection activities into a single work order makes practical sense; however, a standard procedure for recording inspection activities was not followed across all the buildings/campuses of TAMHSC to enable consistency in data validation. A standard procedure for recording work orders is necessary because the number and location of components varies from one campus to another. This led the researchers to make a critical decision about excluding combined work orders for inspection activities from the data set and repeating the statistical analysis across all four categories: mechanical, electrical, plumbing and architectural.
After excluding combined work orders, there were 530 work orders left in the mechanical category, 646 in the electrical category, 550 in the plumbing category, and 660 in the architectural category, bringing the total number of work orders down to 2386 from the earlier total of 3,398 work orders (a 30% reduction). This “re-segregation” of the data is illustrated in Table 2. The t-test results performed with this data show statistically significant differences between the work order processing times of BIM Users and Non-BIM Users in the plumbing and architectural categories, at the .05 level of significance, where BIM users have a higher mean processing time in both cases. There is no statistically significant difference between the work order processing times of BIM Users and Non-BIM Users in the mechanical and electrical categories. The results of the t-test are summarized in Tables 3 through 6 and a graphical comparison of means is illustrated in Figures 1 through 4.
These results are significant as they seem to contradict the perception of owners and facility managers that the use of BIM may help reduce maintenance work order processing times. However, deriving conclusions based exclusively on the results of the statistical analysis may not be appropriate. The fact that there are no standard procedures for recording work orders for all facilities (as demonstrated in the combined work orders) may have affected these findings. Inaccurate recording of information is a hindrance in determining the efficacy of new technological systems. In order to accurately determine the difference in work order processing times, it is crucial for owners and facility managers to establish standard rules and procedures for recording work orders across all facilities.
Table 3: T-test analyses for work orders in the mechanical category
| Test Type | Building Type | N | Mean | Std. Dev. | 95% C.I. | P-value |
| Test-1 (including combined work orders) | BIM users | 247 | 11.5 | 42.7 | (6.2, 16.9) | 0.005 |
| Non-BIM users | 707 | 3.8 | 10.7 | (3.0, 4.6) | ||
| Test-2 (excluding combined work orders) | BIM users | 174 | 3.8 | 6.6 | (2.8, 4.8) | 0.405 |
| Non-BIM users | 356 | 4.3 | 7.5 | (3.6, 5.1) |
Table 4: T-test analyses for work orders in the electrical category
| Test Type | Building Type | N | Mean | Std. Dev. | 95% C.I. | P-value |
| Test-1 (including combined work orders) | BIM users | 368 | 3.8 | 7.3 | (3.1, 4.6) | 0.947 |
| Non-BIM users | 716 | 3.9 | 9.6 | (3.2, 4.6) | ||
| Test-2 (excluding combined work orders) | BIM users | 101 | 3.3 | 3.6 | (2.6, 4.0) | 0.077 |
| Non-BIM users | 545 | 2.6 | 3.7 | (2.3, 2.9) |
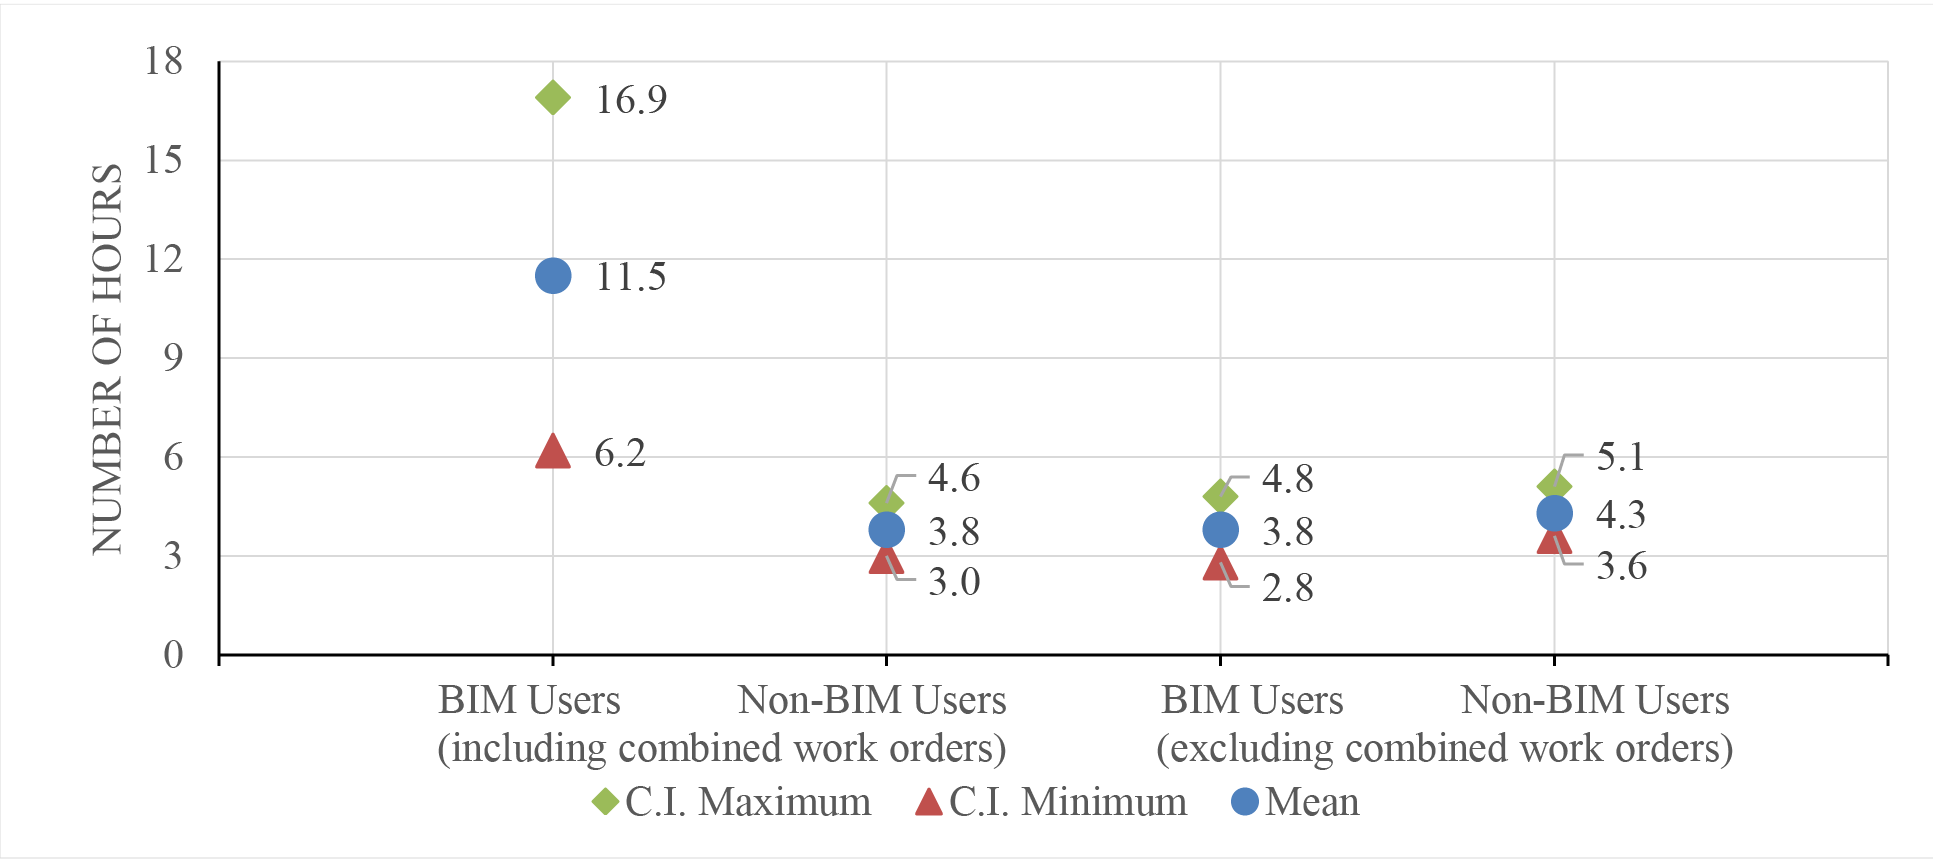
Figure 1: Mean work order processing times and 95% Confidence Intervals (C.I.) for the mean of mechanical work orders in BIM user and Non-BIM user facilities
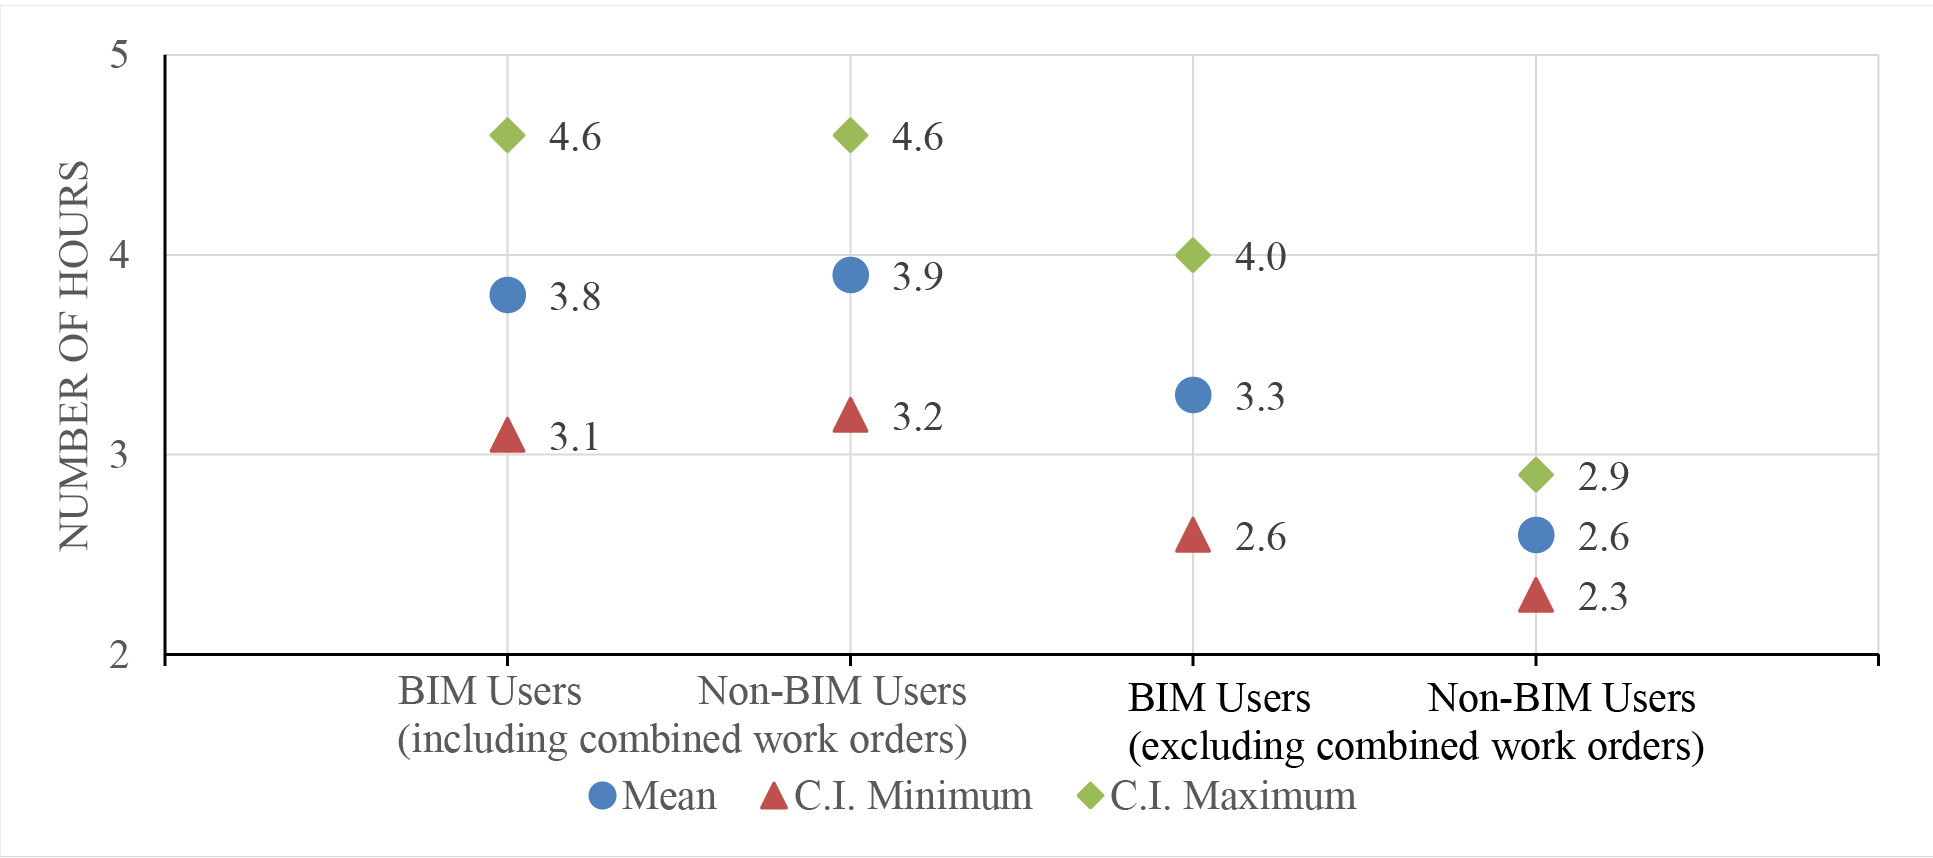
Figure 2: Mean work order processing times and 95% C.I. for the mean of electrical work orders in BIM user and Non-BIM user facilities
Table 5: T-test analyses for work orders in the plumbing category
| Test Type | Building Type | N | Mean | Std. Dev. | 95% C.I. | P-value |
| Test-1 (including combined work orders) | BIM users | 151 | 7.1 | 12.9 | (5.1, 9.2) | 0.001 |
| Non-BIM users | 485 | 2.7 | 4.4 | (2.3, 3.1) | ||
| Test-2 (excluding combined work orders) | BIM users | 119 | 4.4 | 6.5 | (3.3, 5.6) | 0.002 |
| Non-BIM users | 431 | 2.5 | 4.1 | (2.1, 2.9) |
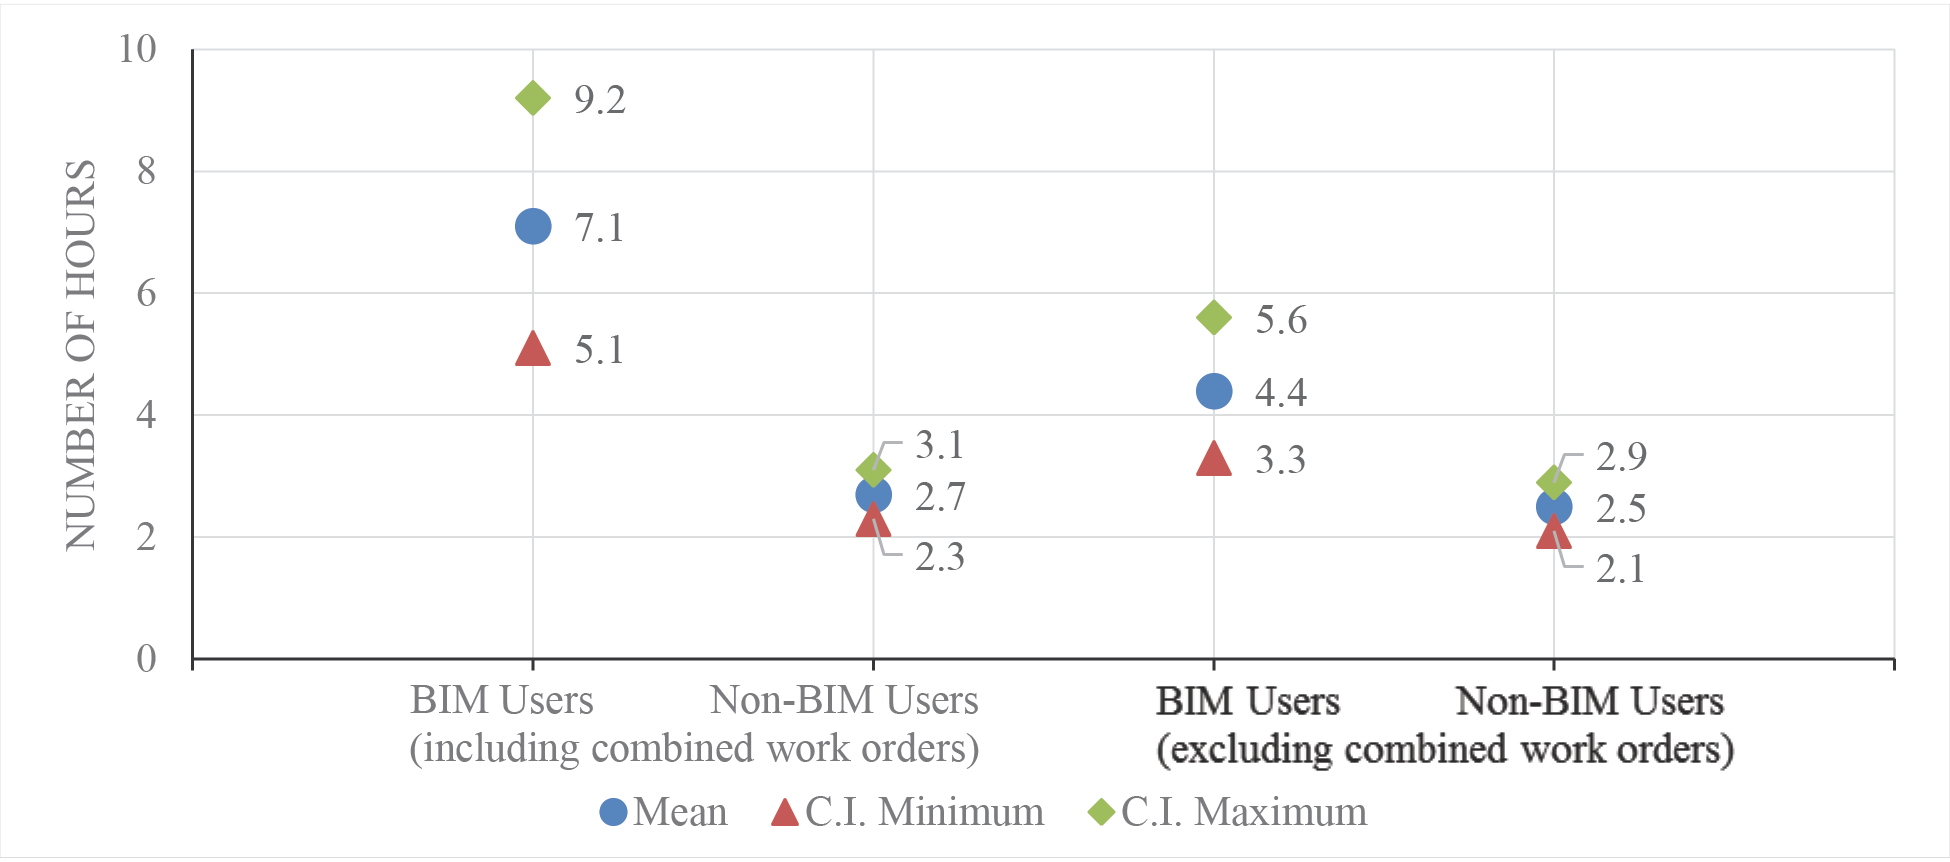
Figure 2: Mean work order processing times and 95% C.I. for the mean of plumbing work orders in BIM user and Non-BIM user facilities
Table 6: T-test analyses for work orders in the architectural category
| Test Type | Building Type | N | Mean | Std. Dev. | 95% C.I. | P-value |
| Test-1 (including combined work orders) | BIM users | 206 | 5.1 | 8.2 | (3.9, 6.2) | 0.265 |
| Non-BIM users | 518 | 8.2 | 61.7 | (2.8, 13.5) | ||
| Test-2 (excluding combined work orders) | BIM users | 185 | 3.7 | 4.4 | (3.1, 4.3) | 0.001 |
| Non-BIM users | 475 | 2.2 | 2.9 | (2.0, 2.5) |
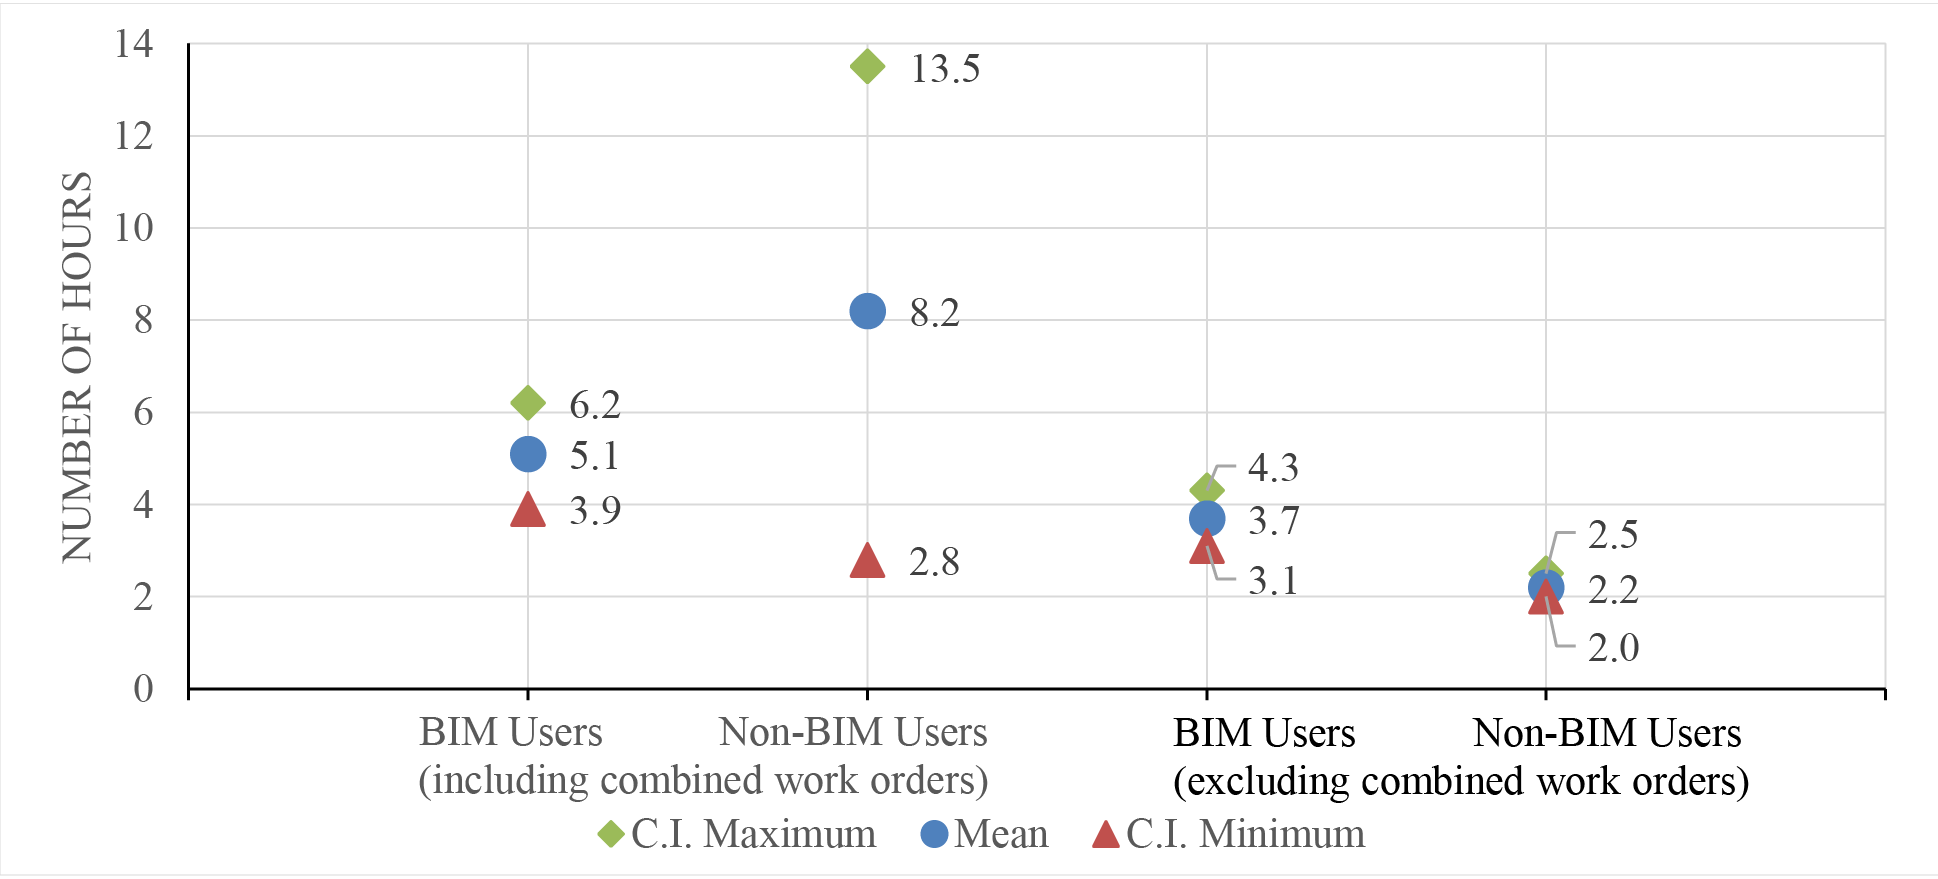
Figure 3: Mean work order processing times and 95% C.I. for the mean of architectural work orders in BIM user and Non-BIM user facilities
Conclusions
BIM has been readily adopted by the design and construction industry because there are immediate benefits in coordinating among multiple teams and time and money savings can be realized in a relatively shorter span of time. FM on the other hand is a much longer process that lasts throughout the entire life of a building and it may take longer to validate the benefits of using advanced technology for FM. The shift from drawing-based FM to BIM and COBie data-based FM is a relatively new development in the industry and TAMHSC is a pioneer in this field as it is one of the first institutions to adopt this approach. However, the FM industry is slow to adopt technology and any such adoption is fraught with multiple challenges. This research investigated a case study to understand the effects of using BIM for FM on work order processing times. To accomplish this, actual work order data from multiple TAMHSC campus buildings was collected and statistically analyzed.
Existing literature on this topic indicates that using BIM and COBie approach for FM presents significant benefits. The U.S. General Services Administration (2011) states that there should be a reduction in the time required to process work orders. To reinforce this, a study conducted by Broaddus & Associates (Beatty et al., 2013), which was based on surveys and interviews, indicated that there could be a reduction of 8.7% in time spent on the work order process. However, the findings of this current study contradict these two sources. Statistical analysis of the actual work order processing times for the work orders shows that more time was spent on processing work orders by using BIM and COBie data for FM in two categories: mechanical and plumbing. In the second test, where combined work orders were excluded from the statistical analysis, it was observed that more time was spent on processing work orders by using BIM and COBie data for FM in two categories: plumbing and architectural.
This contradiction in the findings is significant because most of the earlier studies utilized interviews and surveys to determine potential savings, while this study utilized actual work order processing data to derive its conclusions. Nevertheless, the findings of this study may not necessarily convey an accurate scenario for facilities that use BIM for FM, as there were significant limitations associated with standardization in recording work orders throughout the various campuses. Hence, in order to validate the effects of using BIM and COBie data for FM, it would be important for owners and facility managers to establish standard procedures from the very beginning of a project to accurately collect and record work order data. Using BIM and COBie data for FM is helpful in data integration for FM and it may help to solve problems with interoperability, data storage, etc. that reduce efficiency of O&M activities. However, with the integration of BIM and COBie data into the CMMS, the battle against inefficiency in FM is only half won. Efficient use of BIM for FM will require more effort in the form of process improvement during the early adoption stages. This research shows that in order to extract the best results from data integration, consistent data recording and periodic data validation are necessary.
This paper focuses on work order processing times to determine the benefits of using BIM and COBie-based data for FM. In order to fully understand the real value addition of using BIM and COBie for FM, future research should consider additional factors, such as user satisfaction, ease of use, time difference in accessing information for a building system/component, frequency of accessing information for a system/component, and the corresponding effects on work order processing times. In addition, future research may also consider determining the appropriate data field/s to be tracked for O&M processes based on factors such as building size, building type,
geographic location, expected life of the building, expected return from implementing the BIM and COBie based FM process, and correspondence with an organization’s goals.
Acknowledgements
The researchers would like to express their deepest gratitude to Mr. Mark Cervenka, facility manager of TAMHSC, for sharing data used in this study. Additionally, the researchers are thankful to Mr. Hyde Griffith and Mr. Matt Moore, Broaddus & Associates, for their support in this study.
Industry Response
(By Mr. Hyde Griffith, Broaddus and Associates, personal communication 05/13/2015): These observations will move the industry forward with improved processes, standards, and outcomes. The findings of this research do not show positive results. That is not disputed. However, many factors and forced assumptions contribute to these negative results. We must mitigate these factors by continue to work toward solutions. Early Adopters are challenged to produce return on investment (ROI) and justifications. This work must show us what adjustments are warranted, as this research demonstrates that metrics must be established in advance for outcome quantification.
Preventive vs. corrective maintenance analysis: Previously, we concluded and advised that these should be classified separately. In the current study, that could not be done, and therefore, impacted the results. A more true analysis could have been done with normalized work order (WO) classification. FM system improvement is needed in using the CMMS. It is not enough to specify, capture, organize, validate, and transfer data. Operational use must be aligned to measure the value of the process itself. WO duration is the prime data element in this research. Better process controls at the work order level are needed. Even with mobile technology, this boils down to human factors of time recording.
References
Beatty, R., Eastman, C., Kim, K., & Fang, Y. (2013). Case Study 2: Texas A&M Health Science Center-A Case Study of BIM and COBie for Facility Management. In Teicholz. P. (Eds.), BIM for Facility Managers, 164-184. John Wiley & Sons, International Facility Management Association.
Becerik-Gerber, B., Jazizadeh, F., Li, N., & Calis, G. (2011). Application areas and data requirements for BIM-enabled facilities management. Journal of construction engineering and management, 138(3), 431-442.
Becerik-Gerber, B., & Rice, S. (2010). The perceived value of building information modeling in the US building industry. Journal of information technology in Construction, 15(2), 185-201.
Giel, B., & Issa, R. R. (2014) A Framework for Evaluating the BIM Competencies of Building Owners. In Issa, R. R., & Flood. I. (Eds.) Computing in Civil and Building Engineering, Edition 1(3), (pp. 552-559). Orlando, Florida, U.S.A.
Jawadekar, S. P. (2012). A Case Study of the Use of BIM and Construction Operations Building Information Exchange (COBie) for Facility Management (Master’s Thesis). Texas A&M University, College Station, Texas, U.S.A.
Kasprzak, C., & Dubler, C. (2012). Aligning BIM with FM: streamlining the process for future projects. Australasian Journal of Construction Economics and Building, 12(4), 68-77.
Lavy, S., & Jawadekar, S. (2014). A Case Study of Using BIM and COBie for Facility Management. International Journal of Facility Management, 5(2).
Lucas, J., Bulbul, T., Thabet, W., & Anumba, C. (2012). Case Analysis to Identify Information Links between Facility Management and Healthcare Delivery Information in a Hospital Setting. Journal of Architectural Engineering, 19(2), 134-145.
Lucas, J., Bulbul, T., & Thabet, W. (2013). An object-oriented model to support healthcare facility information management. Automation in Construction, 31, 281-291.
Shen, W., Hao, Q., Mak, H., Neelamkavil, J., Xie, H. Dickinson, J., Thomas, R., Pardasani, A., & Xue, H. (2010). Systems integration and collaboration in architecture, engineering, construction, and facilities management: A review. Advanced Engineering Informatics, 24(2), 196-207.
U.S. Army Corps of Engineers, Engineer Research and Development Center (ERDC). (2006). Building Information Modeling (BIM): A Road Map for Implementation To Support MILCON Transformation and Civil Works Projects within the U.S. Army Corps of Engineers (ERDC TR-06-10). U.S. Army Engineer Research and Development Center, Construction Engineering Research Laboratory and Information Technology Laboratory, 2006
U.S Department of Commerce Technology Administration, National Institute of Standards and Technology (NIST). (2004). Cost analysis of inadequate interoperability in the US capital facilities industry (NIST Publication GCR 04-867). Retrieved from: http://fire.nist.gov/bfrlpubs/build04/PDF/b04022.pdf.
U.S Department of Commerce, National Institute of Standards and Technology (NIST). (2007). General Buildings Information Handover Guide. Principles, Methodology and Case Studies (NISTIR 7417). Retrieved from: http://www.wbdg.org/pdfs/nistir_7417.pdf.
U.S. General Services Administration (2011). “GSA Building Information Modeling Guide Series: 08 – GSA BIM Guide for Facility Management.” Report Series 08 V.1, Office of Design and Construction, Public Buildings Service, U.S. General Services Administration, Washington, D.C.
Want even more Content?

Since you’re already a user, you know that IFMA’s Knowledge Library offers all FM content in one place. But did you also know that by signing up via email to become a registered user, you can unlock even more resources?
Signing up via email for registered access within the Knowledge Library brings more content and functionality to your fingertips. Expect to grow your facility management knowledge, career and network faster than ever before.
Categories
Operations and Maintenance