Sound Rating Criteria for Buildings
The main goal for acoustic design in a space is to keep the background noise levels low enough that normal sound in the space. Example: concert halls tend to need the quietest levels to allow people to hear the intricacies of the different instruments.

The main goal for acoustic design in a space is to keep the background noise levels low enough that normal sound in the space. Example: concert halls tend to need the quietest levels to allow people to hear the intricacies of the different instruments.
Before determining, the appropriate sound level for any space, discussion and understanding of the various ways of measuring sound is a must. It is not as simple as saying the sound in a bedroom should be 30 dB or lower. There are many different measurement methodologies for different conditions. In the next few lines, we can summarize some of the different measurement methodologies:
First, we need to be familiar with two terms:
- 1- Sound Power Level (Lw) which is the total acoustic power radiating from a sound source.
- 2- Sound Pressure Level (Lp) which is the acoustic pressure at a point in space where a listener ear or microphone of a sound level meter is located
Both sound power and pressure levels are represented in Decibels (dB). Sound pressure levels are measured, and sound power levels are calculated from the measured sound pressure levels.
For Sound Power Level:
Lw (dB) = 10 Log (W (watts) / Wref (10-12 W)
For Sound Pressure Level:
Sound pressure levels, whether measured outside in the environment or inside a building space, are used to determine loudness of sound(s), and then used to
determine compliance with building design criteria, building tenant expectations or local noise laws.
Keep in mind that sound pressure increases on a logarithmic scale. As a general rule of thumb, a change of 10 dB means the sound is perceived to be twice or half as loud. Humans can just barely detect a 3 dB sound level difference. They can easily detect a 6 dB change in sound level under most conditions and a change of 20 dB is much louder or quieter.
Now, we can go through different methodologies of sound evaluation.
Actually, there are many methodologies of sound evaluation of spaces; we need to know the differences between them, which method is used under what condition, and for what specific purpose:
1- A weighted dB(A)
dB(A) is simply a filter that adjusts decibels for the frequency range that the human ear is capable of hearing, which is 20 Hz to 20kHz. With the most important frequencies in the 250 Hz to 8kHz range.
This is highly limited as a diagnostic tool because all spectral information is eliminated during measurement.
2- Noise Rating [NR]
Noise Rating curves have been the international standard for indicating acceptable sound levels within a space. NR curves were developed by the International Organization for Standardization (ISO.) Each curve depicts the acceptable dB levels across a range of frequencies between 31.5 Hz and 8,000 Hz (8 kHz).
3- Noise Criterion [NC]
Noise Criterion was developed in the 1950s and was most often used in the United States to depict the acceptable range of background
noise in a space. It is measured in the range of 63 Hz to 8000 Hz (8 kHz).
NC method was limited in that the curves used for evaluation/design did not extend down to low frequencies, where most HVAC system rumbling occurs. A room with a low noise level but a rumbly or hissy spectra can be just as bad as a noisy room.
4- Room Criteria [RC]
Room Criteria is an alternative range of allowable background noise in a building or room that was developed in the 1980s. It is measured in the range of 16 Hz to 4000 Hz (4 kHz). Like NC, RC takes into account the general “hum” of the building, and the RC looks at sounds in lower frequency ranges to account for rumbling of HVAC equipment. RC are depicted with straight lines of constant slope, which were observed to be the average spectrum seen in office buildings in the 1980s.
The RC system was developed response to LF (Low Frequency) and HF (High Frequency) noise problems
Room criteria measures have been developed to evaluate existing background noise levels in rooms as well as to specify required levels for rooms to be constructed, from HVAC equipment and other noise sources.
Also, the Room Criteria are also often used for diagnostics of faulty equipment.
5- Balanced Noise Criterion [NCB]
The new Balanced Noise Criterion curves, updated in ANSI S12.2-2008, accounts for sound frequencies down to 16 Hz, which will address issues from the low-frequency hum of energy efficient HVAC equipment. NCB also reduces the higher frequency levels to eliminate hiss.
6- RC Mark II
This criteria is an improvement to the original Room Criteria. It is almost the same as RC, except that it takes into account the subjective response of room occupants to vibrations of very low frequencies, which are often caused by HVAC equipment. It was developed in the late 1990s.
CONCLUSION:
As a conclusion, Room Criteria measures have been developed to evaluate existing background noise levels in rooms as well as specify required background levels for rooms to be constructed. Criteria are also often used for diagnostics of faulty equipment, as well as it is a way to identify sound quality.
With RC and RC Mark II ratings, the subjective quality or character of the background sound descriptors are defined as follows:
Neutral (N): Noise that is classified as neutral has no particular identity with frequency.
Rumble (R): Noise that has a rumble has an excess of low-frequency sound energy. If any of the octave band sound pressure level below the 500 Hz octave band are more than 5 dB above the RC curve.
Hiss (H): Noise that has an excess of high-frequency sound energy. If any of the octave band sound pressure level above the 500 Hz octave band are more than 3 dB above the RC curve.
Tonal (T): Noise that has a tonal character; usually contains a humming, buzzing, whining, or whistling sound. When a background sound has a tonal quality, it will generally have one octave band in which the sound pressure level is noticeably higher than other octave bands.
Acoustically induced perceptible vibration (RV):
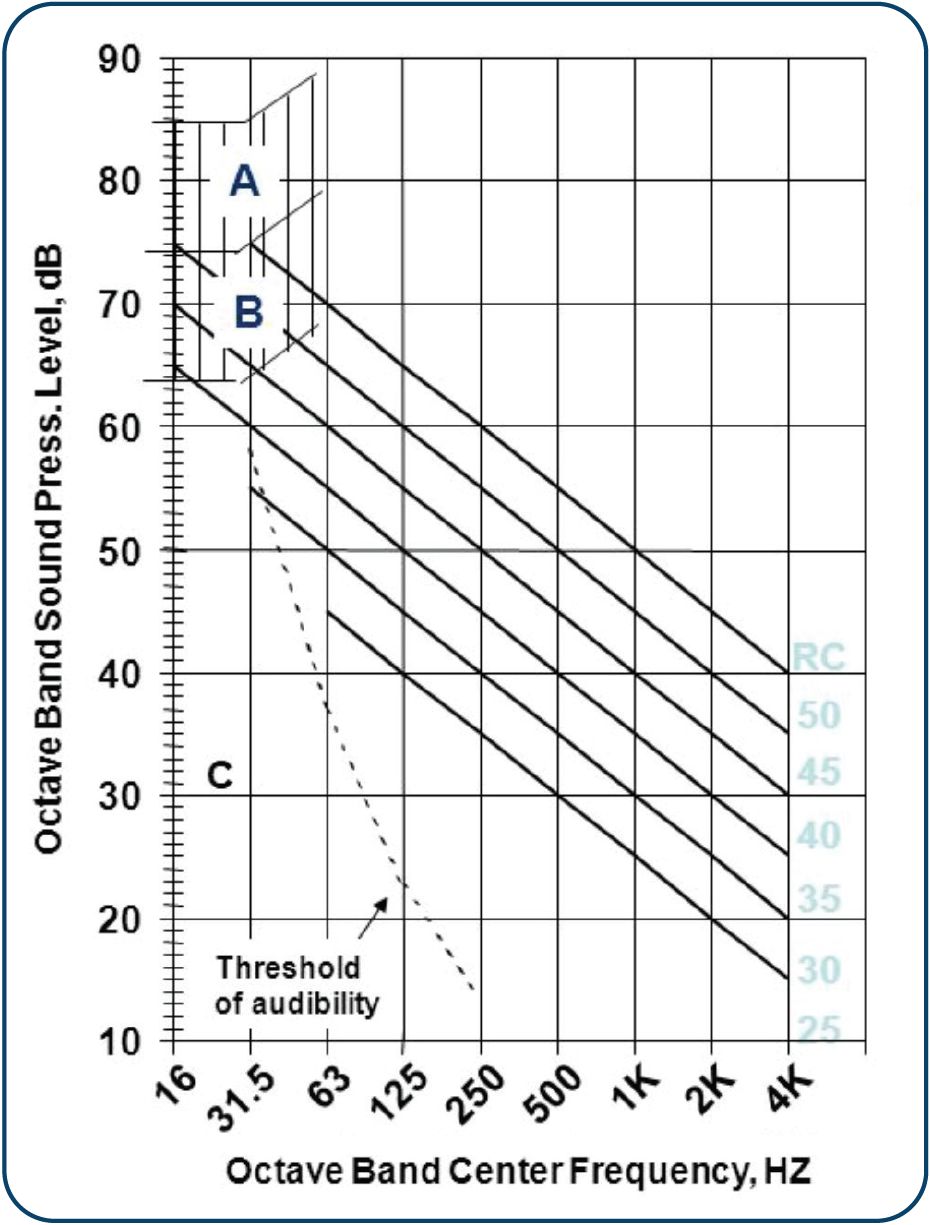
The crosshatched region of the RC curves indicates the sound pressure level in the 16 Hz to 32 Hz octave frequency bands at which perceptible vibration in the walls and ceiling of a room can occur.
If the background noise has any one of the above cases, place one letter or more of (R), (H), (T), (RV) after the RC level. In case of neutral noise add (N).
Room Criteria (RC) Curves
REGION A
High probability that noise-induced vibration levels in light wall and ceiling structures will be noticeable. Rattling of lightweight light fixtures, doors and windows should be anticipated.
REGION B
Moderate probability that noise-induced vibration will be noticeable in lightweight light fixtures, doors and windows.
Adapted from 2009 ASHRAE Fundamentals Handbook - Atlanta, GA
The values below come from a variety of sources around the internet and in published books. ANSI S12.2: American National Standard Criteria for Evaluating Room Noise serves as the basis.
| ROOM/SPACE | DBA | NR | NC/NCB | RC/RCM2 (N) |
| Theaters, Concert Halls, Recording Studios | 25-30 | 20 | 10-20 | 20 |
| Bedrooms, Libraries, Religious Prayer Rooms | 25-30 | 25 | 20-25 | 25 |
| Living Rooms, Classrooms, Lecture Halls, Conference Rooms | 30-35 | 30 | 30-40 | 30 |
| Offices, Courtrooms, Private Work Rooms | 40-45 | 35 | 30-40 | 35 |
| Corridors, Open Offices, Bathrooms, Toilet Rooms, Reception, Lobbies, Shopping | 45-55 | 40 | 30-40 | 40 |
| Kitchens, Shopping, Common Spaces, Dining Halls, Computer Rooms, Workshops | 45-55 | 45 | 40-50 | 45 |
It’s valuable to say that you cannot convert from one methodology to another as number, but you need to calculate the value from raw data.